Edit – This post describes one approach. But, it turns out, there is an easier way: Dynamic Annotations (Part 3)
Part 1 described how to implement dynamic annotations in Tableau using a copy of a measure as a dual axis. However, there were some limitations to that approach. The biggest limitation is that you won’t be able to use the dual axis for anything else.
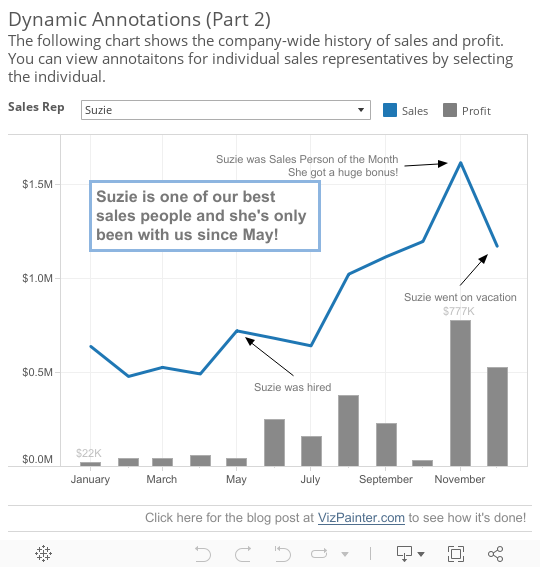
Here is a dashboard with a dual axis combo chart view that makes use of dynamic annotations.
This solution is very similar to the one proposed in Part 1. However, instead of using a dual axis, I’m using the Measure Names / Measure Values. With this approach, I can have as many copies of the measure for the marks I want to annotate as I want. In that way, I can have multiple “sets” of annotations.
Here are the steps:
- Create a parameter to control which set of annotations is shown.

Tip: Use an integer type for performance and ease of coding. You can change the “Display As” value for user-friendliness. - For every field that will define a mark for which you will use dynamic annotations, create a calculated copy. Create a copy for each “set” of annotations. Here is an example of the calculated copies of the Sales measure. Note that the field only has a value when the corresponding parameter is selected. Otherwise it evaluates to NULL.
| Field Name | Calculation |
| Sales (Annotation Set 1) | IF [Annotation] = 1 THEN [Sales] END |
| Sales (Annotation Set 2) | IF [Annotation] = 2 THEN [Sales] END |
| Sales (Annotation Set 3) | IF [Annotation] = 3 THEN [Sales] END |
| Sales (Annotation Set 4) | IF [Annotation] = 4 THEN [Sales] END |
- Once you have a view using the original field to define the marks as you want, replace that field with the [Measure Values] field. Then make sure each calculated copy is placed on the Measure Values shelf.

Tip: You will need to add [Measure Names] to the Level of Detail if you want to connect a line. - Cycle through selecting each parameter value. Add mark annotations as desired for each parameter selection.
That’s it! You now have annotations that dynamically change based on end-user interaction!


This is incredible and exactly what I’ve been trying to do!!! Is there any way you could post the file or send me the file for reference? I’m relatively new to Tableau and find that “tracking down” your steps helps me understand I’m putting things in the correct place 🙂
Thanks!!
Aimee,
Thank you for the kind comments! It looks like the link to the viz is broken. This one should work: http://public.tableausoftware.com/views/DynamicAnnotationsPart2/DynamicAnnotationsPart2
I’ll have to check into why the embedded version isn’t showing. Normally, you can download using the “download” link in the bottom-right corner of the embedded viz.
Regards,
Joshua
Hi Joshua
I am looking for dynamics annotations, But here user is interested to add the notes and findings on the server side .. more like comments but on the server side and on the chart.
I know this is not readily available . But we could using some external api and html pages and drag it as a webpage object. I want to know if you have come across this kind of use case and have any better way of approaching it
Thanks
Vishwanath
Vishwanath,
I think it would be possible. You could also use parameters to allow the user to type in notes that would then be displayed in a view using a calculated field. They would not be permanent, though.