Update: These options are good if you are using Tableau 8.3 or earlier. But if you’re using 9.0 or later, here is a much better option: Level of Detail Calculations.
- Show me a distribution of customers by the number of items they bought.
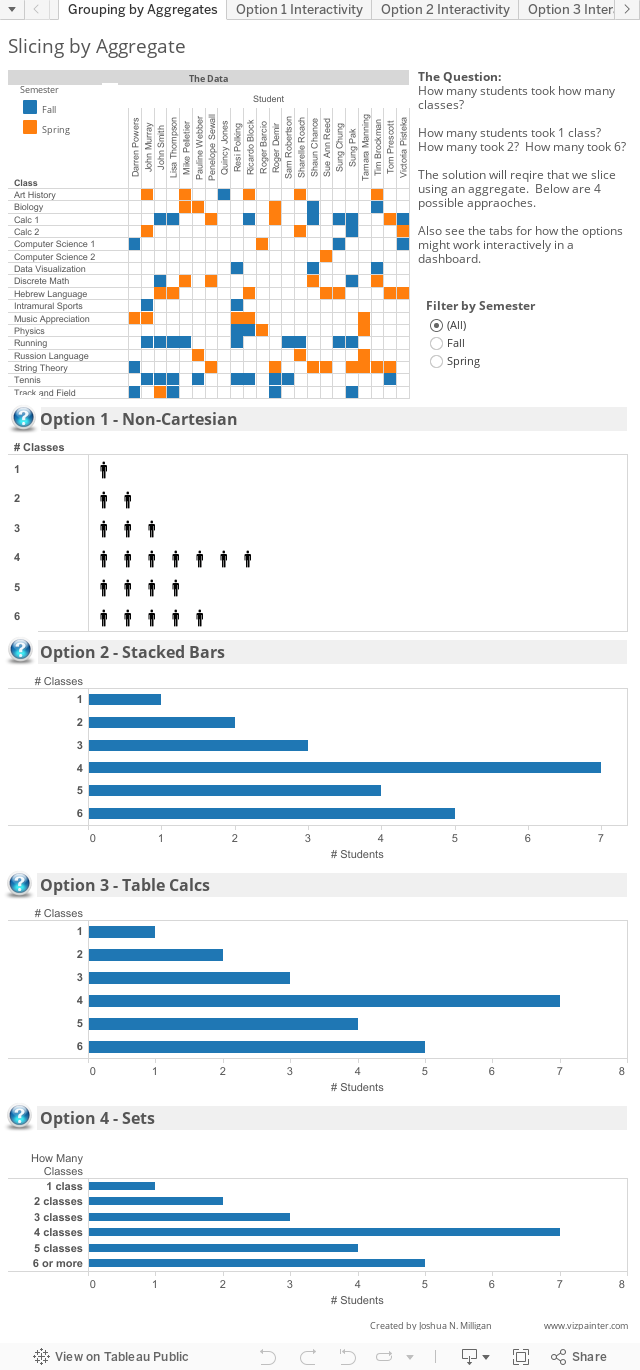
- How many students took how many classes?
- How many people responded to our advertisements? How many advertisements did it take?
All of these questions require a special kind of slicing. Normally, we group or slice data by dimensional values. Bins are special dimensions based on measures, but they don’t aggregate the measures first. How would we be able to show the count of classes taken by individual students and then show an aggregate count of the number of students at each of the values? Here’s a workbook that gives some options.
Have any other options? Leave a reply…


Hi. Saw your post on the Tableau board and then followed the link and came over here. Nice work.
I think you’re right that just stepping back and listing out the different options once and for all is sometimes the best approach. There can be many different ways to get the same thing done in Tableau. It’s like this in many tools.
I bookmarked this page for possible future reference.
Phillip,
Thanks for the kind comments! Have you run into this issue much? Though it is definitely not the most common issue I face, it does seem to come up from time to time.
Regards,
Joshua
Hi Josh,
First off, this post has been super helpful to me as I am a somewhat new tableau user!
I have used your option 3 in order to create a view really similar to what you have, but I am having problems filtering the bar graph. My project is essentially trying to filter by semester, just as your project could. When I download your project, I am able to see that the functionality is possible, so I seem to be having a problem within my project. When I try to filter by semester, the students who weren’t present in that specific semester are filtered out, but the students who fall into each category for the entire year, are still in that category no matter what category they should fall into for first semester. Have you ever run into this issue with filtering sets?
I thought my problem was that I needed to select “Use All” in the General tab for each set, but that is now checked and does not solve the problem. I have no idea as to what could be causing this so if you have any thoughts at all, I would greatly appreciate them!
Thanks so much!
Hannah
Hannah,
It really all depends on what you want to do. Would you want to see all students for the entire year, but have them counted as “0 classes” for the selected semester?
Thanks for the quick response! My specific project is calculating the number of absences for each student so you can see why the number of absences within a specific time period would be necessary. I have also filtered out all of the students who are no longer enrolled so students who are not enrolled are just not included. Does that answer your question?
I may need to see your workbook to understand the specific issue. Do you use the Tableau forums much (http://community.tableausoftware.com/community/forums)? If so, ping me there (just type @JoshuaMilligan in the post) and I’ll be happy to take a look!
Hi Josh,
This is very helpful! Many thanks for posting it.
Is there any way to extend the “Option 3 – table calcs” approach to show the percentage of the total # of students on the X-axis, rather than the actual count of students? It’s often helpful to be able to make statements such as “9% of all students take exactly two classes”.
Also, is there any way to display this as a pie chart rather than a bar chart? I know lots of folks don’t like pie charts, but there are times when they’re useful.
Mark,
That’s a great question. The answer is yes! You can create a calculation similar to this:
[Size] / Total(COUNTD([Student]))
Which uses the existing Size calculated field, which in Option 3 is giving the number of students for each # of classes, and then divides by the total of the distinct count of students. The trick to getting it to work is going to be setting up the addressing and partitioning correctly. In this case, you’ll want to keep the [Size] as calculated along student and the Total as calculated for the entire table. Notice when you edit the table calculation (using the drop down on the field in the view) you get the ability to set the addressing and partitioning — and you can make it different for each nested table calculation.
Regards,
Joshua
Hi Josh,
Thanks again for showing how to extend this output in this direction. The addressing/partitioning for the calculations is both extremely powerful and tricky (at times) to set up. You’ve shown, though, that it’s worth working away at it!
This blog post has been one of the most useful I’ve ever come across!
I just noticed Mark’s question above about adding a percent of total using option #3, the SIZE() table calc while partitioning on a Discrete Measure (unchecking “Ignore in Table Calculations”)
Joshua knows this, but for anyone else looking over this post, getting the percent of total by the Groupings would be far easier using the Sets in Option 4. This is because the aggregate conditions used in the Set allow us to return a row-level Dimension for our “Groupings” — or “How Many Classes?” in this example. Therefore, we have a row-level Dimension which we can use to generate a simple Percent of Total Table Calc against a row-level Dimension value. That’s a bit easier for most users than setting up a Table Calc on top of a Table Calc, with different Compute Usings for each!
Again, I’m just mentioning this as the power of aggregate conditions in Sets is just becoming more and more clear to me. It can really make furthering the analysis much easier, from what I can tell thus far.
Thanks. This was great. I need to do something slightly different. I need to highlight patients who have taken a combination of conditions.. For eg heart disease and diabetes then highlight the row as red. If blood pressure and cholesterol highlight the record with a purple. I tried using sets but this fails and highlights the record even if a patient has only one of the 2 conditions.