The Assignment
When I was in junior high, my math teacher, Mrs. White gave the class an amazing assignment. She gave everyone an overhead transparency (remember those?) with three points drawn on it — labeled 1, 2, and 3. They were the corners of an equilateral triangle.
Then she gave the following instructions:
- Draw a starting point anywhere you’d like on the transparency.
- Then roll dice to randomly select one of the 3 vertices of the triangle.
- Use a ruler to find the half-way point between the starting point and the randomly selected vertex and draw a new point there.
- Roll dice again to randomly select vertex 1, 2, or 3
- Find the half-way between the new point and the randomly selected vertex. Draw a new point there.
- Repeat steps 4 and 5 about 50 times and bring the transparency back to class.
Now 50 times is not enough to clearly see the pattern that eventually emerges. But the next day, Mrs. White picked up all the overhead transparencies and started placing them, one-by-one, onto the overhead projector. Despite the fact that each of us had chosen a different starting place – and each of us had a completely different series of randomly selected vertices, the pattern that emerged was clearly not random. It was a Sierpinski Triangle!
I had a glimpse into underlying order that can emerge from seemingly random chaos. And I fell in love with fractals that day.

The Program
And then, when I went home that night and excitedly told my dad of the results – he said, “Why don’t we write a computer program to do the same thing?” Best dad ever! So we did – and the QBasic program plotted 100,000 points in about a minute! (Data visualization 90’s style).
And then we experimented with different starting places and different numbers of vertices.
And then we thought, “What would happen if we assigned a color to each point based on the random vertex chosen?” The results are interesting. Are you curious? Why not download the Tableau workbook below, go to the Triangle sheet, and add the Random Point field to color? (You’ll have to add it as an attributed – ATTR – so as not to break the table calcs).
And from that point on, the Sierpinski Triangle became my “Hello, World!” for every new technology I learned. In fact, you can find old Euphoria programs I created back in 1997 (when the internet was young and I thought it was spelled “Sepinski”) and also a 3D Sierpinski Pyramid and a fractal fern (of which Noah Salvaterra has a Tableau version!)

Sharing the Experience
And of course, when I first started using Tableau, one of the first things I did was visualize a Sierpinski triangle. I always wanted to share it – but I wanted to do more than just show the fractal. I wanted to use Tableau to teach – to tell a data story that was more than just the end result, but rather the story of process and creation. I wanted to share the experience of building the fractal. And all of that was a little beyond my capabilities at first.
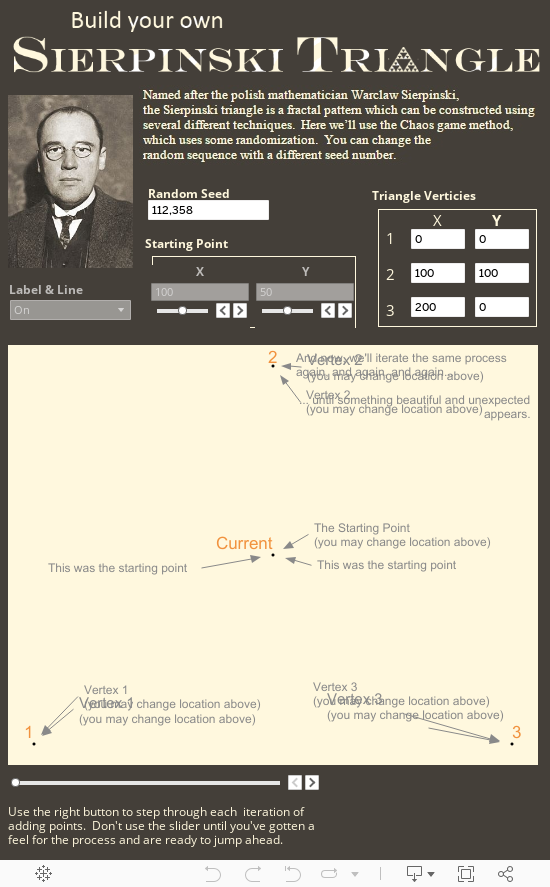
But with some new features in Tableau (thank you, Tableau developers, for LOD calcs!) and some additional understanding of how to mesh Tableau paradigms, I finally have put together the experience I want to share. So, now, using the Tableau workbook below, please enjoy building your very own Sierpinski triangle:


Josh,
Very nice work, as usual. I remember writing code for this fractal while I was in grad school. I had bought a Mandelbrot book on fractals from a science book club (these might not exist anymore!) and got to work on programming some examples. I don’t remember knowing that this pattern was called the Sierpinski triangle. I think I coded this example in Turbo Pascal because it was what I was using for my work at the time. This is a great example to use in Tableau and I look forward to deconstructing what you did.
Here are a couple of YouTube videos to consider. The first one is a 3d fractal exploration into a Mandelbulb and the second is the deepest Mandelbrot zoom animation (from 2010). They are both interesting and the researchers that do the Mandelbulb work have gone off the deep end with animations! I can imagine the day might come when we will be able to do these types of animations in Tableau.
http://www.youtube.com/watch?v=cDd8R0xlkNA
https://www.youtube.com/watch?v=0jGaio87u3A
Thanks for sharing,
Ken