I recently tweeted that Box and Whisker plots have never been my go to DataViz type.

I don’t know what it is, but they’ve never appealed to me. Maybe statistical terms like median, percentile and “1.5 times IQR” are just a layer of abstraction that I’d rather avoid. Maybe I have a fear of funny whiskers. Maybe it’s because a standard view tends to have overlapping marks that obscure how many observations are present.
In fact, this is the “standard” box and whisker, here showing the number of orders for products within some selected sub-categories:

And you’ll notice in the bottom status bar that there are 502 marks. But count the circles in the view. Do you see 502? No, because many are on top of each other. So how many outliers are there? One… ten… fifty?
Now, there are some ways to counter this. One way is to add some transparency to the marks so that ones off by themselves are light and ones that are on top of each other appear darker. I’ve often resorted to “jittering” – intentional or random noise to the view to spread the marks out a bit, like this:

We’ve still got the 502 marks, but now they’ve been spread out vertically (using the Index() function in this example) which allows us to get a better idea of how many products there are in each Order bucket.
This isn’t bad, but it’s still hard to see much difference between some of the # Order values.
A Tableau Innovation
Then Alexander Mou (@Aleksoft) demonstrated a way of creating overlapping box and whisker with a histogram. Now, I’ve always been a fan of histograms. To me, they are much easier to understand. Now I can have my cake and eat it too. Because the histograms are there and are enhanced by the box and whiskers do give additional information.
Check it out:

This builds on the “jittering” concept – but instead of assigning a vertical position for each circle mark, the marks have been changed to bars of height 1 and then stacked on top of each other. In fact, if you click on a bar, you’ll find that each bar is really made up of height 1 segments (one for each product with that # of orders). This is great – a histogram with added value!
Extending it for UI (LODs to the Rescue)
This approach is brilliant and yields an incredibly useful viz. The only issue I have is when I want to use it on a dashboard with certain kinds of interactivity. The stacking behavior that was innovatively leveraged to build the histogram can work against us.
What happens in the dashboard below if I want the user to be able to click on any bar to see the products for a given subcategory with a given number of orders? Try it in the top view in this dashboard:
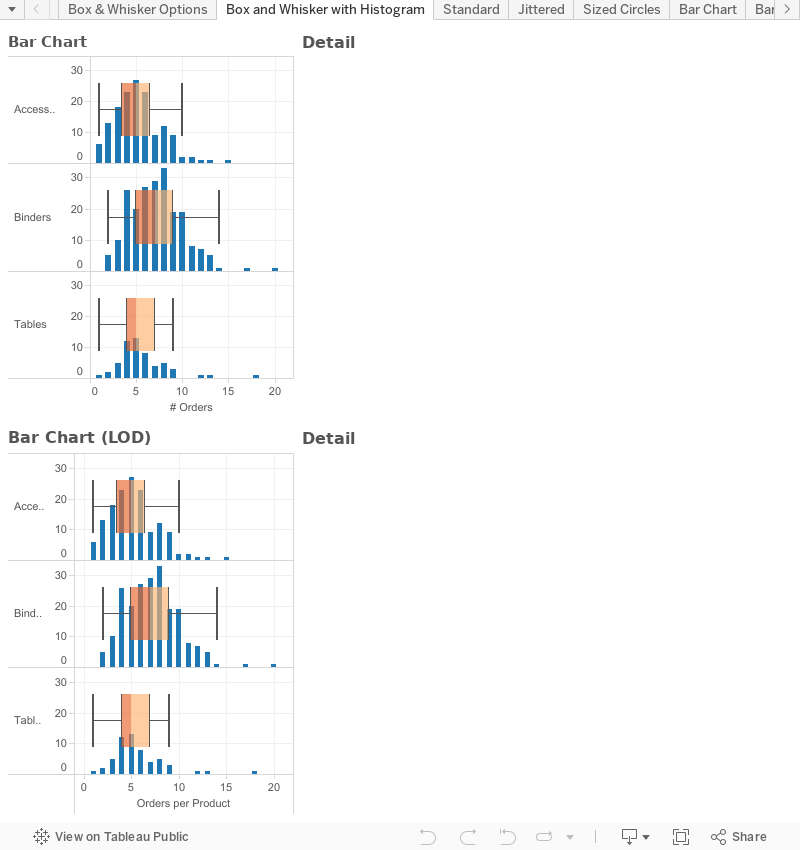
Using the stacking method histogram causes a click on a bar to be interpreted by Tableau as a click on a single segment. Additionally Tableau cannot use the # Orders as an action filter because it is a Measure (aggregate) – and only dimensions can be passed as filters in actions.
So, we simply modify the view using Level of Detail (LOD) calculations. FIXED level of detail calculations can be used as dimensions – which allows us to determine how many orders per product and ultimately pass that as an action filter.

The view we build is a bit more complex, using a dual axis (so the box and whiskers can be displayed for all the products, while the bars on top – which the user will interact with – will not be split by product).
Go back to the dashboard above and try the actions with the lower view. Ah, that’s nice…
One final thought for box and whisker
Alex’s work led me to think of one other way to handle distributions. Instead of jittering or bars, what if you sized the circles, like this?

You’ll notice that the circle size now corresponds to the number of products with that number of orders. This is accomplished using the Size() function and partitioning by the number of orders. I can partition table calculations using discrete aggregates – so I copied the # Orders field from Columns to the Detail of the Marks card (since I still wanted it to be continuous for an axis on Columns), made it discrete and unchecked the “Ignore in Table Calculations” option.
This view could also be improved with LOD calcs so that instead of 502 overlapping circles, we’d get one circle for each # Order bucket. Whether or not I go to the effort of doing that depends on how I want to use the view.
What do you think? Which option do you prefer? Do you have any other options? Leave a comment.


Great extension of the idea, Joshua. I like the sized circles the most. The histogram approach makes me feel like I have to interpret things in too many directions at once, I’m looking simultaneously in a vertical and horizontal direction. Using circles lets me stay in a horizontal orientation (or vertical if you swapped the axes)
Great points, Andy!
Great explorations and variations!
I actually did use LOD for the count of orders and Size() for the bars in my viz. And thus an action can be created by clicking a bar, without dual axis. See if I understand you correctly.
Looking at your screenshots, It looks like [Customer ID] is still defining the view level of detail. As long as you didn’t include [Customer ID] as part of the action, I believe you are correct — the action should work fine.
This discussion made me think of violin plots that aims to address this problem using a box plot with a rotated kernel density plot on each side.
Here is a good example showing it side by side with box plot
http://www.sci.utah.edu/~kpotter/Library/Papers/hintze:1998:VPDT/hintze_1998_VPDT_00.png
Thanks for sharing Bora! I like the violin plot, but still find it a little more conceptually difficult than just seeing a mark for each value (or at least a mark for a set of values).
The guru you are.
Thank you, the sized circles is a great way of getting an accurate message across for my data. Much appreciated.
You’re welcome! And thank you for the feedback