Skip to content

VizPainter

Tableau Tips and Tricks ● Story Telling ● Beautiful Data Visualizations

  • About
  • Posts
  • Tableau Resources
  • VizPainter: Tableau Tips and Tricks, Storytelling, and Data Visualization

Category: DataViz

Here you’ll find tips and tricks for #dataviz and examples of data visualization.

  • Home
  • DataViz
Tableau Trek
All Calculations Dashboards Data Blending & Joining Data Shape & Structure DataViz Fun Level of Detail Calcs New Features Pushing the Limits Storytelling & Commentary

Tableau Trek: Exploring and Using New Features of Tableau and Tableau Prep at #DATA19!

When I was young I used to watch reruns of the original Star Trek. But

November 25, 2019November 25, 2019
Nest Thermostat Data
All Data Shape & Structure DataViz Fun Tableau Prep

Tableau Prep Tackles Nest Thermostat Data

Last year, I went home from the Teknion Christmas party with a shiny, new Nest

October 11, 2019October 11, 2019
All DataViz New Features

Parameter Actions in Tableau 2019.2 Sneak Peek

Tableau 2019.2 is currently in its second beta* which means it is getting closer and

April 17, 2019April 17, 2019
Customers and Stores with exact distance radius
All Calculations DataViz Mapping / Geographic Visualization New Features Tips and Tricks

Draw circles with exact distance radius on maps in Tableau

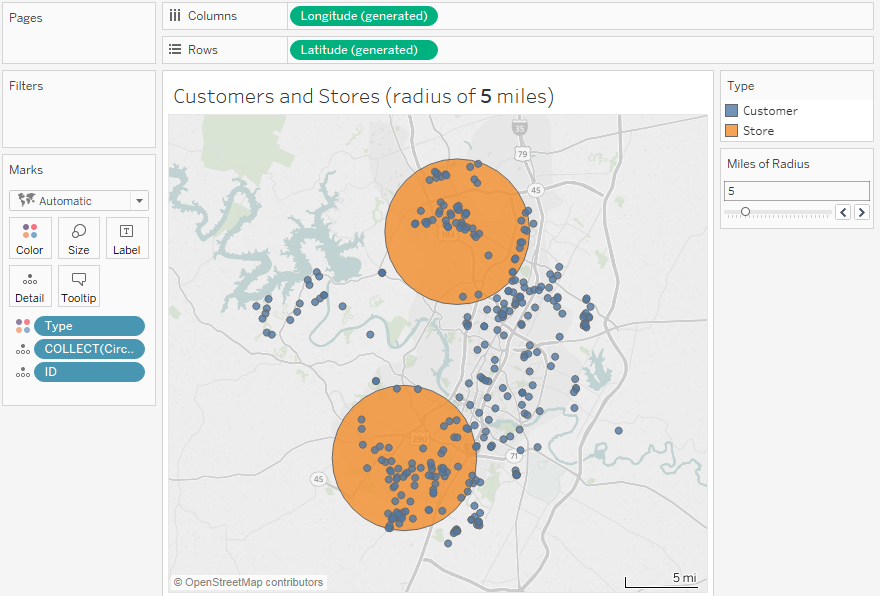
Tableau 2018.1 introduces a lot of new features, especially geospatial features that open a whole

April 24, 2018May 8, 2018
All Data Shape & Structure DataViz Mapping / Geographic Visualization

Hex Map Spatial File

I love hex maps! Especially for the United States, you can keep states in a

December 21, 2017July 29, 2019
All Calculations Data Blending & Joining Data Shape & Structure DataViz Mapping / Geographic Visualization New Features

Hot Swapping Geographic Levels of Detail in a Tableau Viz

  I used to think you couldn’t hot-swap geographic levels of detail in a Tableau

November 13, 2017
All Dashboards DataViz Tableau Tip Tuesday Tips and Tricks

The Need for Speed: How to build Tableau visualizations quickly

I recently competed in the Tableau Iron Viz where Tristian Guillevin, Jacob Olsufka and I

October 24, 2017November 10, 2017
All DataViz Storytelling & Commentary

Don’t miss the miracle of Tableau: It’s more than just DataViz!

I was part of a conversation recently where something like this was said: “We need

May 4, 2017
All Dashboards DataViz Fun Pushing the Limits Storytelling & Commentary Tips and Tricks

Design technique for Tableau dashboards: semi-transparent images

Wow! I’m still stunned to have won the first IronViz feeder contest for 2017! And

April 13, 2017
All Dashboards DataViz Mapping / Geographic Visualization New Features Storytelling & Commentary

The Changing Shape of History: From the Colonies to the United States

I previously shared the fun I had with Tableau 10.2’s ability to connect to spatial files. In

March 23, 2017March 23, 2017

Posts pagination

1 2 3 Next
All Rights Reserved 2024.
Proudly powered by WordPress | Theme: Palawan by Candid Themes.