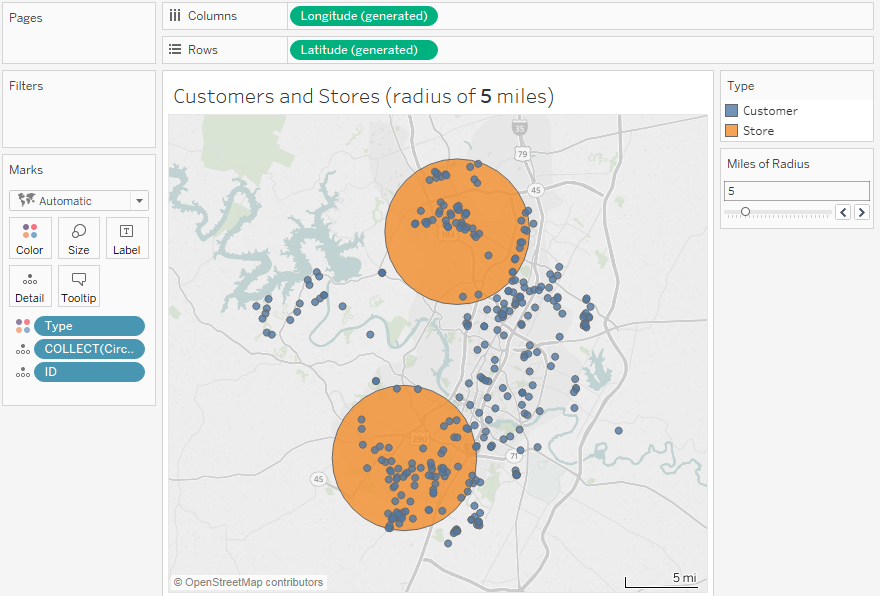
Tableau 2018.1 introduces a lot of new features, especially geospatial features that open a whole new world of data exploration and analysis. With support for SQL Server geospatial data types, there are near-infinite possibilities. I’m sure I’ll have more than a few posts on various options soon! Here’s one thing you can do: render circles with a radius of an exact distance on maps, like this:
By the way, want to see this in action? You missed the webinar on April 25th, but don’t worry – There’s a recording here!
And, it turns out, this is fairly easy to accomplish in Tableau 2018.1.
Creating a geographic function in SQL Server to draw the exact distance
I started by created a function in SQL Server that returns a point that is buffered out to an exact distance:
-- =============================================
-- Author: Joshua Milligan
-- Description: Creates a circle geography based on center point (lat/lon) and radius in meters
-- =============================================
CREATE FUNCTION [dbo].[Get_Circle]
(
 @Lat float,
 @Lon float,
 @Radius_Meters float
)
RETURNS geography
AS
BEGIN

DECLARE @g geography;
SET @g = geography::STGeomFromText('POINT(' + CAST(@Lon as varchar(255)) + ' ' + CAST(@Lat as varchar(255)) + ')', 4326).BufferWithTolerance(@Radius_Meters, .5, 0);

return @g

END
As you can see, the function takes 3 arguments: latitude, longitude, and a radius. The point is created from a linestring defining a point at the latitude and longitude. The radius is passed to the BufferWithTolerance() function to grow the point to a circle of the exact distance specified. With the spatial reference id of 4326 used in the geometry definition, the exact distance is defined as meters. With that, I have something I can use in Tableau.
Using the function in Tableau
I’ve been using Tableau for over half a decade and as long as I remember, Tableau has had pass-through SQL functions. Basically these functions allow you to pass raw SQL directly through VizQL to the generated query. I don’t think I’ve ever really used them…
…until now!
But Tableau 2018.1 introduces a new pass-through function RAWSQL_SPATIAL() which allows you to write SQL that returns a spatial object.
And that was the key, but first, a bit of setup:
- A live connection to a data set in SQL Server containing latitude and longitude (you can extract it after the fact and thus capture the Spatial object in a .hyper file which you could even join or blend to other sources, but the pass-through functions only work with a live connection)
- A parameter to specify distance in miles

- A calculation to to apply the parameter value to records of “stores” while setting records of “customers” to a distance of a quarter of a mile.

- Another calculation to pass through the SQL function call by passing the latitude, longitude and radius converted from miles to meters

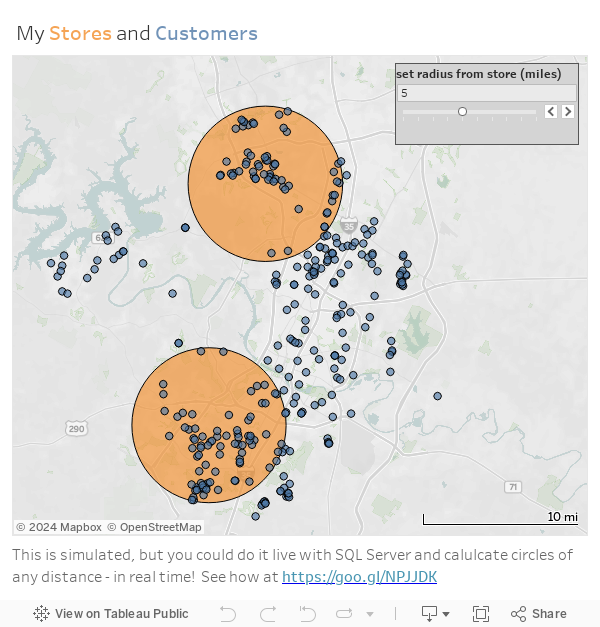
And that final calculation gives me a spatial field that renders with a double-click! With a bit of Tableau visualization magic, the final view not only looks great, but gives me a real-time dynamic tool to evaluate my customer locations in relation to the distance from my stores:

And that, is just the tip of the iceberg when it comes to what can be done with the new SQL Server geospatial support in Tableau 2018.1. What will you do? I’d love to hear your ideas!


About time we got support for SQL geospatial data types. I needed that back in 5.1 ????
I’m guessing the Hyper engine has opened up all kinds of possibilities for efficiently handling things like this and that we’ll start to see all kinds of useful things come in the near future.
Looking forward to testing this out. Thank you for showing how to make it happen. This will be very useful in our supply chain analytics.
Is there a means of using the circle to capture the customers and filter an associated dashboard table similar to using the radius tool?
You’re welcome! I haven’t gotten that far, but I think it would be possible to use the SQL Server geospatial tools to determine intersections of geographies. It’s definitely something to pursue!
Awesome stuff! I am looking at mapping events with a radius and show the points included/excluded, this is just what I need! But I am on 10.5 T-T
Hi Joshua,
Thank you very much for this awesome work. Was looking for exact same feature and this would be a great help for a Viz I am creating.
I have a question. My data is in excel format. Do I have to direct them to SQL server? (sorry, I am a newbie and have no idea about working with SQL)
Hi Joshua,
Thank you very much for this awesome work. Was looking for exact same feature and this would be a great help for a Viz I am creating.
I have a question. My data is in excel format. Do I have to direct them to SQL server? (sorry, I am a newbie and have no idea about working with SQL)
Thank you very much!
Hi Imesh!
Thank you!
Yes, for this specific approach, it does have to be SQL Server. This leverages some specific geospatial tools that are built into SQL Server and not Excel.
Thanks Josh,
Watched the webinar too. Why can’t we just create Miles of Radius as a Measure, and put it into the size filter?
Even if it won’t exactly correspond to real distances, at least you would get relative sizes. And you could set the size so that it was approximately accurate.
Laurence ,
Thank you for attending the webinar! You definitely could simply add the radius to the Size shelf. As you noted it would be a relative indication and not absolute or anywhere close to precise. But if it visually conveys what’s important for the audience, it’s certainly a lot less involved solution!
Which SQL Server do you recommend?
Good!
I have created the exact same thing WITHOUT needing to pass raw SQL, please comment if you need steps. Have a look at the sheet
https://public.tableau.com/profile/khan.ali#!/vizhome/store2customerradius/Sheet1?publish=yes
Hi Ali!
Thank you for sharing! That’s a great approach. A lot will depend on the needs for the data structure. One of the main benefits of using the SQL Server spatial options is that the entire shape (circle in this case) takes just one record of data – so if you have a record per customer or store then all of your other measures aggregate nicely. The downside is that it only works with SQL Server or one of the few other databases that support spatial objects. The benefit of your approach is that it works no matter what the data source as long as it can be structured to have a record per vertex of the polygon. But that’s a lot more possibilities than just the few databases that support spatial objects. With your approach, I think you have 72 records – one for each 5 degrees of the circle to draw the polygon. That works well, but will take some blending or LOD calculations to make sure aggregations work as desired. Again, thanks for sharing!
Thanks for the appreciation and for the reply. The downside of my approach is that it makes the data huge, you guessed it right, due to duplication of each data point multiple times to make sure the circle is smooth (I created 25 vertex as degree to convert the polygon into a nice circle), that means if the data source is huge is will increase in size by 25x. Blending and LOD calculation were no sweat for Tableau. BTW i was wondering if you know how to calculate the number of customer in the radius, it will make the dashboard much more intuitive. Thanks for your thoughts!!!
Can you please share the steps highly appreciate your support
Thanks for the appreciation and for the reply. The downside of my approach is that it makes the data huge, you guessed it right, due to duplication of each data point multiple times to make sure the circle is smooth (I created 25 vertex as degree to convert the polygon into a nice circle), that means if the data source is huge is will increase in size by 25x. Blending and LOD calculation were no sweat for Tableau. BTW i was wondering if you know how to calculate the number of customer in the radius, it will make the dashboard much more intuitive. Thanks for your thoughts!!!
Do you happen to know how to create this in MySQL? I’m having some difficultly recreating with MySQL
Hi Kevin,
I don’t believe it will work in MySQL. SQL Server and a few other relational databases have the required geospatial capabilities required, but not all databases support it. However, I’m seeing Tableau build in more and more geospatial capabilities natively in Tableau, so stay tuned!
Hi. Thanks for the post. I keep getting the following errors though.
An error occurred while communicating with the Microsoft SQL Server data source ‘ShowData’.
[Microsoft][ODBC Driver 17 for SQL Server][SQL Server]The identifier that starts with ‘CREATE FUNCTION [dbo].[Get_Circle]
(
@Lat float,
@Lon float,
@Radius_Meters float
)
RETURNS geography
‘ is too long. Maximum length is 128.
[Microsoft][ODBC Driver 17 for SQL Server][SQL Server]Incorrect syntax near ‘)’
Any thoughts as to why Tableau may be throwing these errors? I put your code into a new custom sql data source.
Hmmm… Let me look into that. I’m not sure what that error indicates