Skip to content

VizPainter

Tableau Tips and Tricks ● Story Telling ● Beautiful Data Visualizations

  • About
  • Posts
  • Tableau Resources
  • VizPainter: Tableau Tips and Tricks, Storytelling, and Data Visualization

Category: Mapping / Geographic Visualization

Here you’ll find tips and tricks for mapping and geographic #dataviz. And you’ll find visualizations and dashboards that make use of maps.

  • Home
  • Mapping / Geographic Visualization
All Calculations Mapping / Geographic Visualization New Features Pushing the Limits Tips and Tricks

Parameter Actions + Geospatial Functions = Tableau Awesomeness!

The very first blog post I ever wrote demonstrated how to calculate distance between locations

December 17, 2019December 17, 2019
All Data Blending & Joining Data Shape & Structure Mapping / Geographic Visualization New Features

Spatial Joins in Tableau with Excel, Text, Anything

How can you join your non-spatial data to spatial data? Using the latest spatial functions, you can achieve spatial joins in Tableau with almost any data source.

August 14, 2019August 14, 2019
All Calculations Mapping / Geographic Visualization New Features

Great Circles & Curved Flight Paths: Tableau & SQL Server Geospatial

How can you leverage SQL Server geospatial tools in Tableau to draw cool curved flight

June 8, 2018June 8, 2018
Customers and Stores with exact distance radius
All Calculations DataViz Mapping / Geographic Visualization New Features Tips and Tricks

Draw circles with exact distance radius on maps in Tableau

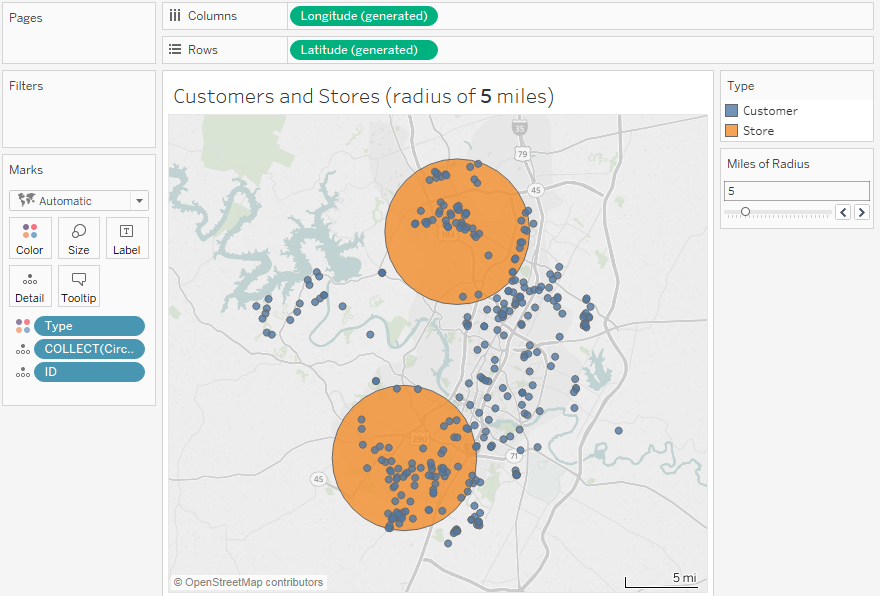
Tableau 2018.1 introduces a lot of new features, especially geospatial features that open a whole

April 24, 2018May 8, 2018
All Data Shape & Structure DataViz Mapping / Geographic Visualization

Hex Map Spatial File

I love hex maps! Especially for the United States, you can keep states in a

December 21, 2017July 29, 2019
All Calculations Data Blending & Joining Data Shape & Structure DataViz Mapping / Geographic Visualization New Features

Hot Swapping Geographic Levels of Detail in a Tableau Viz

  I used to think you couldn’t hot-swap geographic levels of detail in a Tableau

November 13, 2017
All Dashboards DataViz Mapping / Geographic Visualization New Features Storytelling & Commentary

The Changing Shape of History: From the Colonies to the United States

I previously shared the fun I had with Tableau 10.2’s ability to connect to spatial files. In

March 23, 2017March 23, 2017
All Dashboards Data Blending & Joining DataViz Dates Fun Mapping / Geographic Visualization New Features Storytelling & Commentary

Fun with spatial files in Tableau 10.2

Tableau 10.2 is almost here! And it’s time to celebrate! One thing I’ve always wanted

February 22, 2017March 13, 2017
All Dashboards DataViz Mapping / Geographic Visualization Storytelling & Commentary

Where Food is Scarce…

Having never previously entered into the Tableau #IronViz feeder contests, I was eager to participate

April 22, 2016April 26, 2016
All Calculations Data Blending & Joining Mapping / Geographic Visualization Tableau Tip Tuesday Tips and Tricks

Tableau Mapping Tip: Geographic Drill Down

Previously,  we saw how to capture and use Tableau’s automatically generated latitude and longitude for

February 17, 2015February 29, 2016

Posts pagination

1 2 Next
All Rights Reserved 2024.
Proudly powered by WordPress | Theme: Palawan by Candid Themes.