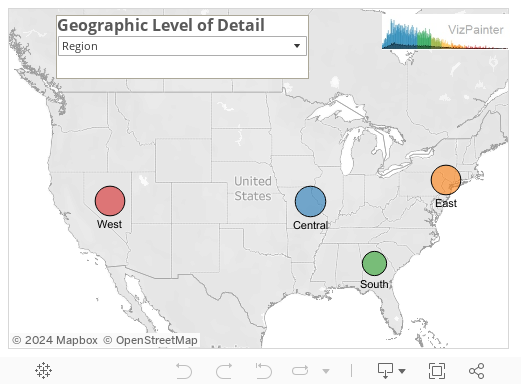
Previously, we saw how to capture and use Tableau’s automatically generated latitude and longitude for custom geocoding. Now, we’ll extend that technique to give us the ability to drill up and down on various levels of geographic detail in a single visualization:

The data is fairly standard. We have Regions which contain 2 or 3 Areas which contain multiple Zip Codes:

Only Zip Code is recognized as a standard geographic field. Tableau is nice enough to supply the fields Latitude (generated) and Longitude (generated) based on the Zip code. However, we can’t use those fields in calculations or blending. So, we’ll capture them in a separate data source (along with the associated Region, Area, and Zip Code) just like we saw in the previous tip.
Data Blending to Control the Level of Detail
Now we can blend between the two sources on any of the fields they share in common:

But why set the level of detail of the blend ahead of time? This gets much more exciting if we create a parameter and a couple of calculated fields to allow the end-user to control the level of detail of the blend.
Here the parameter:

Then, I’ll create a calculated field that returns the desired dimension based on the parameter selection:

We’ll create this calculation in both the primary and secondary data sources. Why? So we can blend on that field instead of any of the others:

And now, the level of detail of the blend changes with the user selection. Instant geographic drill down (and up again!)
Here it is in action:


Would this method work for filled maps as well?
Unfortunately not. You could use filled shapes, but they would be plotted at the geographic center of the lowest level of detail (Zip in this case) which almost certainly wouldn’t match. You might check out this thread on the Tableau forums as there are some interesting thoughts on making filled maps work.
Hi Joshua. Brilliant – that’s so exciting. Never thought of blending on a calculated field. The only trouble with learning new and better ways of doing things is that I’m constantly having to re-write my workbooks. Here we go again!
I know the feeling – I look back at things I designed a year ago or 3 months ago and think, “If I’d only known what I know now!”
Hi Joshua,
Thank you for your post! I do have a question for you. When I tried to use your method on a world map (country – state drill down), some locations got mixed up because they are states that have the same names in different countries. Can this be resolved? Thanks!
hi
can you show how to do same for country, city, state in superstore data as all these are already geographic fields . I am trying to do drill down but it is not working.
best regards
amrit
Same problem here.. searching for hours how to display zip code based data in a filled map on country level. Is there no easy solution for this?
Joshua –
Have to tried this with long and lat coordinates that you generate yourself? I’ve been trying to drill from self-designated areas, but I’m not sure if having my own coordinates is a limitation.
Emily
Thank you for nice tip Joshua!
Works brilliantly with countries and regions. However, the tooltip options seem to be the same for both levels of detail. I haven’t found a way to change it to a model where in region the tooltip would show:
“Region: xxx
Sales: yyy”
And in country level tooltip would show different info, for example:
“Region: xxx
Country: yyy
Sales: zzz”
Does anyone have ideas how to do this?
This works wonderful with my own data set! Question for next step, is there a way to switch between fill map and circle cities?
I can’t get mine to work and I don’t know what I am doing wrong. I didn’t do the blending step because both my geographies Region and Province are in the same datasource so I went ahead with the parameter and the calculation. I triple checked and downloaded your workbook and everything is set up properly …