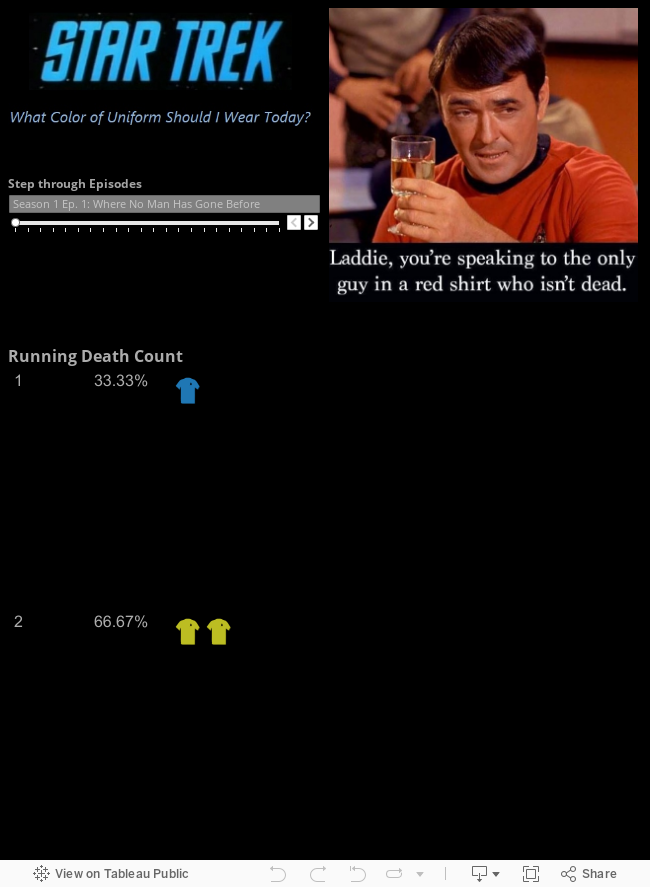
The term redshirt has come to mean any stock character who is introduced in an episode only to be killed off. This comes from the original Star Trek where red uniforms are thought to be a death sentence. But is it really true?

I decided to check using Tableau. This dashboard was originally created as an entry for the 3 minute win challenge. I spent a couple more minutes to clean things up for embedding in a blog. If you are interested in watching the creation, check out the video.
By the way, a good data analyst will point out that this analysis isn’t complete. There’s at least one more factor to consider before you can really answer the question. Any one see it? Leave a comment.


How did you get the shapes to repeat along the axis? I’m trying a similar idea but Tableau is only displaying one shape at the cumulative total on the axis.
Chris,
The key is that there isn’t an axis. As long as you don’t have a continuous field that defines an axis on Rows or Columns, then any marks drawn for dimensions in the level of detail will be stacked (by default) in the pane. You can check the stack options from the menu (Analysis –> Stack Marks).
Regards,
Joshua