The Issue
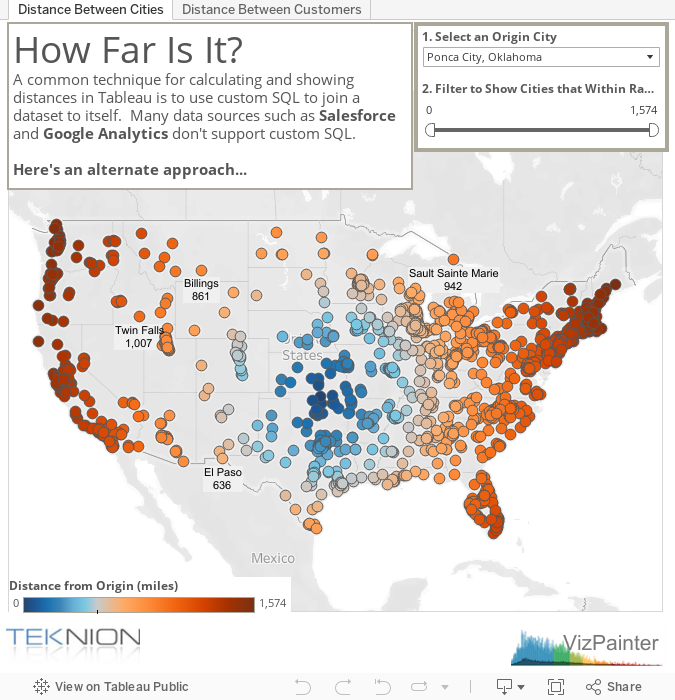
A common technique for calculating distances in Tableau is to use a custom SQL statement to join a dataset to itself. This causes each data row to contain two latitude and longitude values. Then a row-level calculation can use a formula (such as Haversine) to determine the distance. However, many data source connections such as Salesforce and Google Analytics don’t support custom SQL. Furthermore, cross joining large datasets can be quite costly and, even if possible, may not be practical.
Here is an alternative: use a table calculation to calculate the distance using latitude and longitude from different records!
The Alternate Solution
The basic approach is simple and is made up of two parts:
- Create a row level calculated field to set the order in which the geographic points should be evaluated. In the example dashboards above, the origin is set to 1 and all other points are set to 2.
- Use the LOOKUP function to determine latitude and longitude for the origin to compute the distance to every other location.
The first part is relatively easy. In the example dashboards above, a parameter is used to allow the user to select the origin (city or customer). For each record, if the field value matches the parameter value, then the result is 1. Otherwise it is 2. This calculation will serve as the ordering of the table calculation in the second part.
The second part is a little trickier. The initial row-level distance calculation, assuming that the latitude and longitude of both points are contained in the same record, looks like this:
| 3959 * ACOS ( SIN(RADIANS(Lat)) * SIN(RADIANS(Lat2)) + COS(RADIANS(Lat)) * COS(RADIANS(Lat2)) * COS(RADIANS(Lon2) – RADIANS(Long)) ) |
Using a couple of table calculations, the calculation becomes:
| 3959 * ACOS ( SIN(RADIANS(LOOKUP(AVG(Lat), First()))) * SIN(RADIANS(AVG(Lat))) + COS(RADIANS(LOOKUP(AVG(Lat), First()))) * COS(RADIANS(AVG(Lat))) * COS(RADIANS(AVG(Lon)) – RADIANS(LOOKUP(AVG(Lon), First()))) ) |
You’ll notice that every reference to Lat from the original formula was replaced with LOOKUP(AVG(Lat), First()). The same is true of the original Lon. The lookup of the first values is the origin’s latitude and longitude. The other latitude and longitude references are for the destination. Since this is a table calculation all references are now aggregates: e.g. AVG(Lat).
The last step to a working solution, is to make sure the table calculation is addressed and ordered correctly.
- Right click the field in the view and select “Edit Table Calculation…”
- Select the “Advanced…” option
- Make sure to Address by the fields that determine an individual geographic location (e.g. City and State, or Customer)
- Sort the calculation using the first calculated field that set 1 for the origin and 2 for everything else.
|
|
 |

That’s the basic approach. Download the workbook above and take a look to see the details!


Hi guys. This is great. Couple questions:
How do I set the origin city? I have been able to add the distance formula and the look up formula, but I cant get my map to understand which one is the origin and which one is the destination. Perhaps a little further explanation on how to set up these two would be helpful. Also, I’d like to add the star icon when a origin city is selected to make it easier to understand.
Look forward to your comments.
Jorge
Jorge the Origin city is a calculation that compares the value selected in the parameter with the name of the city. The calculation gives the origin city alone a value of 1 and all other cities the value of 2. That allows for the distance calculation to use the LOOKUP table calculation to find the latitude and longitude of the origin city in comparison with every other city.
Feel free to download the workbook and take a look at the internal workings!
Regards,
Joshua
Joshua,
I was so happy to find your Map Distance workbook since it represents exactly what I’m trying to do! For some reason, I’m having trouble getting the distance calculation to work. Would you be able to assist me?
Regards, Jennell
Sure! What are the specifics?
The distances are quite large and don’t make sense. Are you able to take calls?
Thanks Josh, unfortunately my free trial expired and my companys executives wont let me pay for the service until I show them a finished product. So I was able to get everything you specify here, but I am missing a small detail somwhere. I got the parameter drop down, and I got Tableau to identify the 1 and the 2 between the origin and the destination. However, on the distance formula, the latitude and longitude for the origin dont seem to be working, thus giving me a distance of 0.0 miles. I am sure if I opened your workbook and looked at it I could find within a minute, but unfortunately that is not an alternative for now.
Below is a link to the workbook I am working on.
http://public.tableausoftware.com/views/FUELSNewsRackPricingMap/RackPrices?:embed=y&:display_count=no
Thanks,
Jorge
Hi Joshua,
I have read your distance calculation in Tableau. But I have some problems,
1. How can I get the blue and the orange label besides the data (the excel file name)
Candy,
Do you mean the data blending? Blue indicates a primary data source and orange indicates a secondary. When you start a new view, whatever data source you use to add the first field will be the primary data source. All others will be secondary.
The Distance Range is getting calculated for a fixed origin.
Is this because in the “Distance from Origin” the “At Level” and “Restarting every” are not highlighted and I am not able to update as mentioned in the above screen shot.
Please advice.
Thanks,
Vishant
This works Great!!…Thanks Joshua Milligan.
How can I apply the “Distance from Origin filter” to other sheets.
Thanks,
Vishant
What does the 3959 refer to in the second step of your process? Is this something unique to your data?
That’s the radius of the Earth in miles, if you need it in km, you will need to use 6371.
At the moment, though my formulas are the same as yours, I can’t get one location to identify as the origin, ie irrespective of which parameter you have selected, if you were to upload the data, no row would have the value of 1 under ‘Origin Order’
Great map! I have a question about using road distances instead of inserting the lat/long based calculated field.
I have a set of cities in a distance matrix with the road distance/travel time between each city pair (thanks Google Maps API). How can I import and reference this data instead of the calculated distance field?
Hi,
I can’t seem to get my head around this, can the workbook be downloaded to show your workings?
Cheers!
Yes. Try the download link at the bottom of the dashboard.
Hello,
I am trying to figure out how i would plot auto dealers across the country and customers that belong to said dealership (with the distance). I want to have a STAR where the dealers Long/Lat is and still plot all their customers Long/Lat.
So in short i have customer_long and customer_lat and on the same record i also have a dealer_long and dealer_lat.
Any suggestions on how i would accomplish what you have above with this dataset?
Robert,
Right now, there isn’t an easy way to do this. If you can union together the existing data with a copy of itself (Custom SQL or Tableau’s built in union) so you have both sets of Lat/Long in only 2 fields (with a 3rd field indicating whether the row is for a customer or a dealer, then it becomes a lot easier. Tableau did preview an upcoming feature that would allow you to plot multiple geographies on a single map, but that’s not out yet (not even in 10.2 beta).
Hope that helps!
Hi Josh,
Thanks for the wonderful post which helped in creating something similar. But it would be great if you could suggest something like this:
Once I select the Range filter to filter out the cities say from 0 to 100 miles from the origin, then I want to see the total Sales of all displayed cities only.
Now the issue where I am stuck is that because the Distance calculation is a Table Calculation, it does not filter out the Cities rather just hide the cities outside the Range. So, how to define a sum or grand total calculation which shows only the value for the displayed cities?
Hope you to see some guidance from you!
Thanks,
Ashish
Ashish,
Thanks for the comment! You are right that a table calc filter won’t work in this case, but you could use another calculation to get only the values you wanted. For example, let’s say the existing calculation is named [In Radius?]. You could write another calculation with logic like:
WINDOW_SUM(IF [In Radius?]
THEN SUM([Value])
END)
Hope that helps!
Joshua,
Thanks for post and step by step explanation…
I was trying to do this based on zip code from N miles radius. The way you showed i have 1st dataset contains all the zip codes, latitude and longitude values.
In the second dataset i have the data related to my business (may not contain all the zipcodes)
I Created Distance From Origin and Origin Zip parameter when i use the distance from origin i am getting null values when i remove the null values its only working for the Zips available in the second dataset. Its not able to calculate other zip codes with in N miles radius.
I am trying to show with in the 50 miles radius for a given zip code i want all my customer base(second dataset) in a map.
Any help….
hmmm… I’m not entirely certain what’s going on, except that the latitude and longitude values are needed to calculate the distance. If they are not present, you will get a null result and simply filtering out the null results will result in not ever getting those data points. Is it possible to get the lat/lon values?
Hey Joshua, Thanks for this tutorial. It really helped me set up this viz, but i am not able to get the distance function to work. I am not sure where i have messed up the calculation, but it keeps centering around a zip code – 01040 instead of centering around the zip code that has been selected in the parameter.
Hugely appreciate any help you can provide in this.
https://public.tableau.com/profile/farhan7#!/vizhome/WIP-MedicalExpenses/ofmax
Nevermind, I got this to work. Thanks anyways !!
How do I do this with 2 sets of data? For example, I have a customers and store list. I need to say that store A has so many customers within some many miles of it.
Javid,
You should be able to do this with a secondary data set. Either you could blend the data and the table calculations should work in much the same way as everything would be aggregated first. Or possibly, you might consider using a cross-database join to bring the data sets together at the row-level. Hope that helps!
Hi Joshua! This is great stuff, along the lines of something I am trying to crack.
I have a data set which is basically a list of zip codes of all our retailers and I need to determine the retailers that have no retailer within x miles of him. So basically have circles around each zip which highlight as long as they don’t intersect any other circle (not sure if this makes sense). I am having trouble calculating the distance of each zip from every other zip. I tried the custom sql approach but I am not able to wrap my head around that approach. Any help will be greatly appreciated!
Hi MK! I’d be happy to take a look at what you’ve done so far. Do you have a way to share it?
Hi Joshua!
Sharing a google drive link here. I was having some trouble publishing this to Tableau Public, this was just easier.
https://drive.google.com/drive/folders/1NNLLnucct-ZxogJfjsEXIBfiApk-akH7?usp=sharing
I managed to get concentric circles using custom sql. What I am struggling with now is that I want to identify only those stores that don’t have any other retail store within the X miles of it. Basically for the view I have in front of me, Tableau should highlight all the stores that don’t have an intersecting circle and maybe I could list the names of these stores on the side – like the dashboard I have. Is there a way I can do this? I tried creating some calculation that would calculate the distance of each point on the circle to every other point on the other circles. Doesn’t seem to work.
Thanks again for your time.
MK
Hi Joshua,
I was having some trouble posting it to Tableau public. Sharing a google drive link just cause it was easier.
https://drive.google.com/open?id=1NNLLnucct-ZxogJfjsEXIBfiApk-akH7
I managed to get the radial distances mapped. What I am struggling with now is that I want to identify only those stores that don’t have any other retail store within the X miles of it. Basically for the view I have in front of me, Tableau should highlight all the stores that don’t have an intersecting circle and maybe I could list the names of these stores on the side. Is there a way I can do this? I tried creating some calculation that would calculate the distance of each point on the circle to every other point on the other circles. Doesn’t seem to work.
Thank you for your help!
MK
Hi Joshua,
Six years on and this post is still helping the community out! Way to go! I’ve recreated your example without a hitch using my own data. Is it possible to show a summary map of all points plotted irrespective of distance, then when the user selects a city, you drill down to the viz as you have it above? I have a specific use case where they’d like to start out looking at data across the whole of Australia, then take a look at individual states and from there pick a specific city/site (value in your parameter from which to calculate the distance).
Any ideas would be much appreciated!
Cheers,
Hi Michelle!
Thank you so much for your kind words! Yes! I think you could do that. With parameter actions you could start with an empty parameter value (and show all cities) then when a city is selected and populates the parameter, you could calculate the distance and filter as desired.
Hi, Joshua
This is really helpful to me. Btw quick question.
Origin City in Parameter, List of Values are set of City and State.
How did you put two values in one column?
Did you just make another field and add it? Or is there another way?
Thanks.