Sheet swapping or sheet selection is a technique used to switch out views in a dashboard.
The basics approach for building a sheet selector is:
- Place multiple sheets in a single layout container
- Hide the titles of the views
- Use filters to show / hide the views
There is a good KB article here: Creating a Sheet Selector for a Dashboard
This workbook extends that example to demonstrate:
- Swapping with Parameters
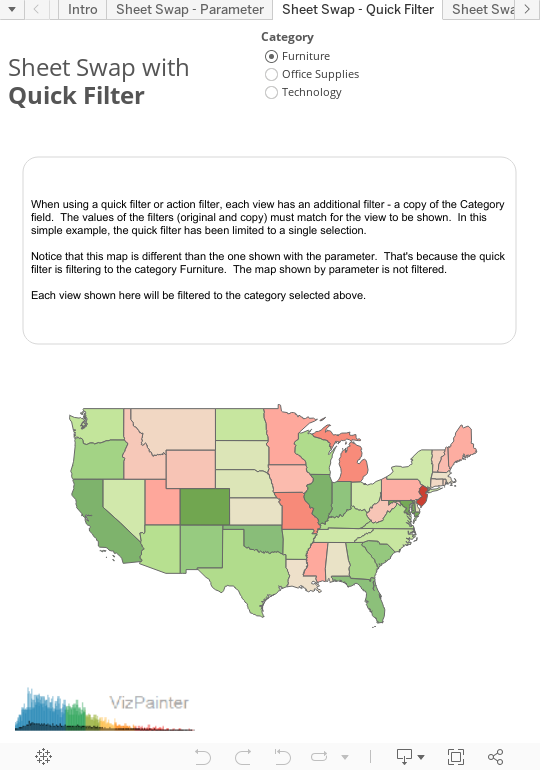
- Swapping with Quick Filters
- Swapping with Action Filters
- Swapping based on How Many Items are selected
- Showing a “No Data!” Message when a view is empty
By the way, if you like this post, check out other Tableau Tips and Tricks
Update: Thanks Jonathan Drummey for pointing out the simpler approach of using a copy of the dimension instead of a table calc!
Use the Tabs to navigate through the examples.


Thanks for posting this! Do you happen to have a list of instructions? I am trying to replicate what you did in the “Swap Sheet – Action Filter” dashboard but as a newbie I am having trouble getting started. Thanks again!
Lucy,
I’m definitely working on putting together some details on how it works. Check back or subscribe to the RSS feed and hopefully I’ll have something here in a week or two!
Did you ever publish directions on how to swap with an action filter?
No detailed directions yet – you should be able to download the workbook and hopefully get a sense of how to do it. But I promise – details coming soon! …relatively soon, at least 🙂
Hi Joshua,
I am wondering if you’ve ever posted the instructions for swapping sheets with actions. They would be very helpful, as I am having a difficult time following the steps done in the workbook.
Many thanks!
Hey! I am having trouble with dropping the three elements into a Vertical Layout container and having it display the three graphics!
what im i doing wrong
Hmmm… I don’t know right off. Do you have a way to share a screenshot?
Thanks for the amazing sample. I was looking at ‘Sheet Swap – Quick Filter’ I noticed that both Category (copy) and Category are in the filters, but I wasn’t able to find Category under Dimensions? What I did to my workbook was that I created a string Parameter and then created Calculated Field using that Parameter, I’m not sure what the (copy) in your sample does, simply a copy of the created Calculated Field?
Great post – really helped my approach, which has evolved into using two parameters to display different graph styles with different axis titles when combinations of parameter options are chosen. However, when some of the options are chosen, the colour legends are visible, but on others they disappear. Any thoughts on why this is happening? I can post a workbook if it helps?
Hi Nate. This is happening to me to. Did you ever figure out the solution?
I missed Nate’s original post – but if either of you happen to have workbooks to share, I’d be happy to take a look!
Hi Joshua,
Thanks for the post. However, after I put sheets into containers (either horizontal or vertical), when I select one of the parameter value, the sheet does show up, but the container still keep the white area for the other sheets. Can you please advise how to solve this issue? Thanks!
Hmmm…. I’m not sure what is going on. Any way you can show me a screenshot?
Hi Josh,
I think I figured out what’s going on here. When those sheets are using Pie Charts, the selection does not work. After I changed the pie charts to bar charts, it works fine now. (In my case, I want to show 3 pie charts for user to select.)
My Tableau version is 8.3. Maybe you can test at your end too.
Thanks!
Hi Joshua,
great method!
but I have a couple of questions regarding this method.
Once I put my 3 worksheets with a sheet swap with parameter(Let’s call the filter – Sheet Filter) . However, i also needs to include quick filter of each worksheet on the side.
The Sheet Filter would apply to the ‘quick filters’ as well.
That means when I swap to another sheets, the other filters will be empty with headers appearing. So is there a hack for this?
If possible, is there a way to create a global filter or not apply ‘sheet filter’ to certain components?
1. I cannot use a floating container because we are applying to multi-screen size.
2. I need the headers.
Thanks
A floating container would have been my first thought. I’ll have to give it some thought…
I have hierarchy and like continent and country and based on country I need to show a different chart for each country. How to use hierarchy
Nanda, You should be able to filter each chart to keep only the country you want for that chart and then use the sheet swapping technique shown. See if that works and let me know!
Hi Josh,
This is really interesting stuff.
Now if the two sheets have two different underlying data sources (Super Store and World Indicators for example) is it possible to achieve this?
Any help would be much appreciated!
Thanks
Yes! You can map actions between different data sources in the edit action dialogue (choose Dashboard > Actions from the menu, then edit the action and change from “All Fields” to “Selected Fields” at the bottom of the window, then chose source and target data sources and fields that correspond). Hope that helps!
Hi, here the number of worksheets to hide/show are only 3.
What if I have 8 worksheets to show hide using the same technique.
I have implemented the same, but the view is not good. Worksheet to show doesn’t expand itself to the container size because of the hidden worksheets.
Please let me know if there is any alternative here?
Unfortunately, there is a space of a few pixels that is taken by an empty sheet. It’s not very noticeable with a small number of sheets, but does start to add up with a larger number. Unfortunately, I don’t have a great solution. The best I’ve been able to do is to adjust the layout so that the empty space isn’t a major factor (see the Choose Your Own Adventure viz which has multiple worksheets at the bottom)
I have a question about the practical example dashboard. Once you select a state from the US map and are presented the map of the state, is there way to select those individual points on the state map? I’d like to bring the points to the front so that they are selectable, but I can’t figure a way to do so.
You could add a filter action to the National map dashboard, which then can take you to a different State dashboard showing points or smaller geometries (zip codes). I even took it to a third level by having a hyper local dashboard (store level). Unfortunately, a dashboard can only handle 2 geometries at a time of similar type so this my alternative to using scale level dependencies in one map.
You could try using map box to create your own basemap but that would be a static background layer.
Joshua,
I noticed this post mentions “Swapping based on How Many Items are selected”, however I can’t seem to find any information about that.
The only link I see is for basic sheet selection.
Can you share a link to the full post for “Swapping based on how many items are selected”? Does this also apply to how many items the total number of records/MeasureA are included in the view based on filtering?
Thank you,
Jordan